Conclusion

A relation between the pH and the Soil Organic Matter is that organic acids in humus (organic matter) don’t resign their hydrogen (H) easily. Hydrogens are part of carboxyl (-COOH) groups under acidic conditions. Once a positive H is released, the negative COO- develops a negative charge. When the pH of the soil increase, the release of H of the carboxylgroups buffer the increase of pH and creates also a cation exchange capacity (negative charge). With an increase of organic matter, the soil will turn back into its natural capacity, what means an increase of pH in acid soils.

The difference between the main stages was obviously measured by percentages. Sample 1, 6, 7 and 8 had a higher percentage in the Organic Matter than the other samples. High organic matter percentages were measured by the forests and the heathlands. This is because plant productivity is linked to organic matter. High organic matter increases productivity and in turn the organic matter productivity increases. The samples 1, 6, 7 and 8 were forest ore places near to the forests and because of the lower pH’s of these samples in relation to the organic matter this was correctly analysed.

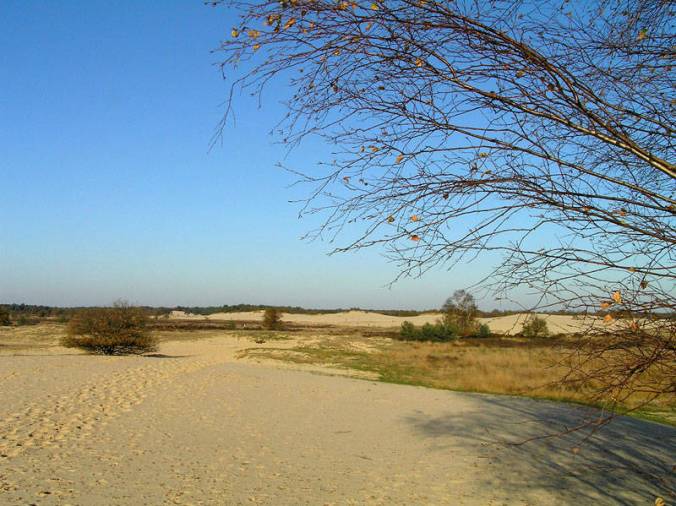
In this experiment is the maximum amount of water retention of the soil of the Loonse and Drunense Dunes was analysed in duplicate (D) in the laboratoria at Avans Hogeschool in Breda. Because of the different succession stages there was a variety of percentages of each gram soil per gram water.

Fluctuactions between in samples of the forests (24,30,33 and 38%), the grasslands (32 and 34%) and the heathlands (24,26,28 and 32%) of water retention were the samples with the highest amounts. This fluctuations means that these areas with the highest amount of water retention are in relation to the experiment of organic matter having a high organic matter percentage, because of the peaty soil.

An higher percentage of organic matter means that the water retention will be higher because of a smaller size of pores between the particles. Sandy soils provide easier passages or transmission of water through the soil. This is why the Bare Sand have a lower percentage of water retention than the other succession stages.

Saturation of dissolved nutrients in the water in the soil leads to precipitation of the nutrients, what leads to nutrition loss in the layers of the soil. The mobility of dissolved nutrients leaching faster than undissolved nutrients, this is a big important knowing for the chemistry.

By preceding winters the wet soil is good for the flora and fauna. Plants needs water to growth and survive and animals such as microorganisms can also survive.

In this experiment the chemical and nutritional benefits of organic matter are related to soil organic matter, water retention, cation exchange capacity, and the ecology of the growing plants and organisms. Organic matter retains nutrients such as nitrate, phosphate and ammonium for the mineralisation and immobilization through decomposition of organic matter by microorganisms and prevents these nutrients leaching to deeper soil layers in relation to the water retention. Soil organisms retain the available nutrients that are not taken up by plants. In organic matter depleted soils like bare sand, these nutrients would be lost by leaching through the soil.

Anion exchange capacity is that the soil will attract and retain anions (negative charge). The anions held and retained by the soil particles such as phosphate and nitrate. Anion exchange capacity depents on the pH of the soil and increases as the pH of the soil decreases.

In the forest there was a high amount between seven and 13 mg/kg. The heathland had a lower concentration like 5 mg/kg of nitrate and the bare sand raised up to 6 mg/kg by the third sample and the last sample, sample nine was under the detection limits.

This means that the nitrate in the organic matter in the forest is very high comparing to the other results. In the heathland there is like circa 50% less nitrate than in the forest what means that there is less organic matter in this succession stage. Because of the hight result in the third sample of the bare sand, it looks like that there has been an enormous amount of nitrogen content of horse stool put down.

Phosphate analysing was extreme high by the second sample in the grassland and the sixth sample of the heathland/forest. This is probably only phosphate because there is also orto phosphate. Orto phosphate is bounded to carbon lengths. Expected is that the orthophosphate would be much higher in the forest because of the organic matter.

Ammonium content was under the detection limits. This means that the content was too low for analysing the amount of ammonium. There could be something wrong with the default ore with the method.

Discussion

Soil pH

Fluctuations of pH might be caused due to seasonal climate and soil physical-chemical changes, which affect value of pH. Therefore a range of pH is presented to show possible pH variations in a soil samples.

Sample ID Succession class Average of experiments
  Potassium chloride KCl Demi water
1 Forest (north) 3.94 6.09
2 Grassland – edge of northern forest 4.53 5.8
3 Bare sand 4.77 6.07
4 Heathland 4.75 6.45
5 Heathland  with bare sand 4.77 5.78
6 Grassland 4.40 5.85
7 Forest (south) 4.06 5.74
8 Heathland 4.50 5.97
9 Bare sand 5.01 5.75

Table 1: pH of soil samples

According to pH classification ranges, pH of sampled soils would fall in a range of extreme to very strong acid based on pH in KCl solution, where in demi water it falls in moderate to slight acid. Also, variations in pH in different succession stages do not differ significantly. There, more acidic pH is in both forest areas (pH= 3,94 and 4,06) and grassland (pH = 4,40). Also, relation between pH and content of soil organic matter (SOM) can be made. SOM acidify soil by producing hydrogen ions which lower the pH. Both soil samples of forest (1 and 7), heathland (8) and grassland (6) have higher content of SOM and lower pH than other analysed sites.

Cation exchange capacity

Most of the analysed samples resulted in cation exchange capacity within negative range of -22cmol+/kg to -199cmol+/kg. Only samples 3 (bare sand) and 5 (heathland/bare sand) shows positive amounts. However, based on literature study, sandy soil has low cation exchange capacity (about 0 – 5 cmol+/kg) where clay and organic matter have high CEC, ranging between 30 – 100 cmol+/kg. Measured CEC in soil samples seems to be too high for common cation exchange capacity in a sandy soil. Therefore, results of cation exchange capacity are not reliable, which means that measurements are not accurate.

Table 2: Cation exchange capacity in analysed areas

Sample ID Succession class CEC cmol+/kg
1 Forest (north) -193
2 Grassland – edge of northern forest -39
3 Bare sand 59
4 Heathland -22
5 Heathland with bare sand 13
6 Grassland -199
7 Forest (south) -150
8 Heathland -29
9 Bare sand 809

However, some conclusions can be based on literature search. Most of collected soil samples have a soil texture of sand and sandy/loamy sand with low CEC. It shows that base cations or nutrients like Ca2+, Mg2+, K+ tend to be leached out in sandy soils. On the other hand, CEC might be higher in upper layers of the soil with higher soil organic matter content. For example, sampled areas of grassland (2) and heathland (7) would have higher CEC because of higher soil organic matter content (see results of soil organic matter). Because of that, nutrients availability and soil stability are expected in these areas, which lead to favourable conditions to succession rates.

Nitrogen mineralisation

In order to determine net mineralisation rates over time, concentrations of nitrates, nitrites and ammonium are necessary to know. Determination of nitrogen mineralisation and nitrification in a soil was not finished because of technical failure of laboratory equipment. Therefore, only samples of ammonium nitrogen (NH4-N) concentrations have been measured.

In table 3, it can be seen that not all ammonium nitrogen concentrations are identified, because some samples were under detection limits of ions chromatography. Results show, that higher NH4-N concentrations have been detected in bare sand areas (sample 3 and 9) and heathland with open areas of bare sand (sample 5). In general, ammonium nitrogen concentrations did not differ significantly within different succession stages, but are higher in areas of bare sand.

Table 3: Ammonium nitrogen increase in nitrogen mineralisation experiment

  NH4-N concentrations, mg/l 
Sample ID Day 0 Day 4 Day 8 Day 14
1 Forest (north) n/a n/a n/a n/a
2 Grassland – edge of northern forest n/a n/a n/a 28.05
3  Bare sand n/a 1.98 n/a 29.71
4  Heathland n/a 2.11 n/a 29.56
5  Heathland with bare sand n/a 2.11 n/a 31.77
6 Grassland 1.94 2.11 n/a 26.67
7  Forest (south) n/a 2.03 n/a 28.89
8 Heathland n/a n/a n/a n/a
9 Bare sand n/a 1.98 n/a 34.92

n/a – under detection limits

Interestingly, the highest NH4-N concentration (34,92mg/l) was found in bare sand (sample 9) near the main entrance of the park. These variations might be caused by the fact that higher NH4-N concentration was found near the horse pathway and close to agricultural zone, which possible influence higher nitrogen depositions to the bare sand.  Ammonium is common form of deposited nitrogen and it gives a basis to nitrogen mineralisation, so the assumption can be made that net nitrogen mineralisation will be greater in areas with higher NH4-N and soil organic matter contents. Comparing organic matter content and ammonium nitrogen concentrations, it can be predicted that possible higher net nitrogen mineralisation rates would result in sites of heathland (sample 6) and grassland (sample 8).

Results

Here are the results of the laboratory tests done during the project.

Soil Organic Matter content

a
During this experiment there has been done analysing about the Soil Organic Matter in the different succession stages such as the bare sands, grasslands, heathlands and the forests. In the graph there is a difference between the main stages about the percentage of the organic matter in the soils. The organic matter in the forest sample 1,5 and 6 are much higher than the grassland, heathland and the bare sand.
Water Retention

b
In this experiment the water retention of the three main succession stages such as the bare sand, grassland, heathland and forest were analysed on different places has been analysed. The highest percentage organic matter was been found in the forest sample 1D (Duplicate) and the grassland and heathland separately. Samples with the lowest percentage was been found in the grass-/heathland and the bare sand. It seems to be the same kind of soil because the percentages are next to each other.

Determination of Available Nitrate, Phosphate and Ammonium in the soil
In this experiment the soil of the three succession stages were analysed of available nutrients such as nitrate, ammonium and phosphate. Because due to technical failure of ions chromatography, NO3-N and PO4-P were analysed suing Hach Lange kits, and NH4-N with ions chromatography. The ammonium level was probably to low to analyse because the results were under the detection limit. Nitrate was analysed and the results gave the highest results in the forest. After the forest (1,7) the heathand (6,8) has the highest results. What is striking is that one sample of bare sand (3) gave a high result and the other one a low under the detection limit result. The expectation of this high nitrate level in the bare sand result is that there has been made a mistake, otherwise it could be that there is no vegetation what could uptaken the nitrate ore the slowly transforming of N into NH4-0N and then in NO3-N by microorganisms. The range that was been used was between 0,23 and 13,50 mg/l * 10 is (mg/kg) = 2,30 and 135 mg/kg.

c

The phosphate would be expected in the forest because of the higher amount of organic matter. Obviously there was a higher amount founded in the grassland 18mg/kg and a lower percentage in the forest 1.8 mg/kg. There were two samples ‘under the detection limit’ founded. The range that was been used was between 0,05 and 1,50 mg/l * 10 is (mg/kg) = 0,5 and 15,0 mg/kg.

d

Field Work

Field work: soil profile identification

Soil samples were collected in each different vegetation class. Also, soil profile and texture per soil sample were analysed visually by chemistry group. For example colour, organic matter, texture, area surroundings. Therefore, table were created with all relevant data about the identification of soil samples at the fieldwork. General comments are given to provide more information about the area, any specific observations of the site, soil composition and so on. Important to note, that percentage of soil texture and soil types are given in approximately values and are measured by visual observations at the site, therefore some errors of soil identification might occur. Soil texture triangle was used to determine these parameters (see soil texture triangle).  Soil horizon indicates different layers beneath or above the soil profile. Soil horizons might differ in characteristics, like particle size, colour, soil organic matter content. Soil texture indicates physical properties of the size and type of particles in the soil.

Soil profile identification and analysis

1 2 3 4 5 6


Identifying Species

by Patrisha Maghanay

moss

A picture of Campylopus introflexus, the invasive species in the dunes.

For the ecology section of the project, it is imperative for us to identify the species–plant or animal– found at the sites as each of them will serve as an indicator of the dunes’ environment and give an idea as to the nutrient content of the soil, in particular, the amount of nitrogen that is in it. Nitrogen causes plants to grow, and a high nitrogen to phosphorus ratio makes the plant grow quickly, but with not enough of the other nutrients to support it, it dies down quite quickly. It turns into mulch and become organic matter for the next generation of plants to grow on, and this is basically the basis of a very fast plant encroachment. Certain plants have been identified to be good indicators of high nitrogen in the soil.

Lichens among the different mosses

Lichens among the different mosses

Lichens are good identifiers as well as mosses. Mosses grow rapidly on soils that have high nitrogen content and these–especially those of Campylopus introflexus type–snuff out the lichens by stealing nutrients from them and robbing them of sunlight. The presence of Campylopus often mean that there will be very little to no lichens in the area, and that means that the area has high nitrogen in the soil.

map

Map of Phase II, along with the transect (B1 to B7) and outlier test sets (B8-B9).

Sampling for us required creating a transect line through the chosen phase and performing a random 1x1m2 quadrat sampling along that line. We counted the amount of species, took note of the dominant species and tried to find campylopus and any type of lichens. We also noted down the environment in the sample sites; whether or not it is damp, or it is shaded by the trees around it, etc. Finally, we collected samples of the plants that were in the quadrat. We were to take these back to the labs at Avans to try and identify them.

After collecting plant species from the various sites, the plants were identified in a lab at the university. Various dichotomous keys were used in order to identify plant species. These keys were found electronically, through scientific sites on the internet, and most of the species were keyed in two different identification softwares in order to ensure that the species was correct. The most distinctive features of the plant in question were first determined, as well as its general properties like colour, height, leaf type and reproduction method. After that, the necessary information was inputted into the identifier and a possible list of species is produced. At this point, visual analysis was done in order to find the best match for the plant. Afterwards, a picture of the plant is taken and its name is written down on an Excel sheet that is organised per sample site.

History of the Loonse en Drunense Dunes

by Patrisha Maghanay

loonseendrunenseduinen

The Loonse en Drunense Duinen is a national park in the Netherlands nestled between the cities of Tilburg, Wallwijk and ‘S-Hertogenbosch. Named after the two villages to its South and North, it is the biggest active sand drift area in Europe with more than 4000 hectares of nature. The sand was left behind during the ice ages but was heavily covered in top soil and organic matter. It was stripped bare during the middle ages due to overgrazing and severe deforestation, which revealed the sand underneath.The sandiness of the area was exacerbated by the 80-Year War between the Spanish Empire and the Dutch republic, which prompted people to plant pines to accommodate the high need for wood then, as pines grow and mature fast. However, during the war, under the command of William Van Oranje, areas around the dunes were ravaged because the duchy of ‘s-Hertogenbosch was allied with the Spanish. He employed the ‘scorched earth’ technique, which destroyed plant matter and reduced the area to ashes.

355662

The Loonse en Drunense dunes are also prime example of an early ecological disaster where deforestation ran rampant and the sand began to make its way through to villages, where the villagers combated the crawl by planting oak trees at the border. During the 18th and 19th century, they tried this method with pine trees.

Today, the Loonse en Drunense is enjoyed by many for its tranquil scenery and beautiful landscapes.